California’s New Congressional Districts: Fair or Unfair?
After the completion of the 2020 United States Census, each state with more than one U.S. Representative was tasked with redistricting. This process occurs every 10 years to account for population shifts within the state, equalizing representation across political districts. California was only apportioned 52 representatives — one less than in the two decades prior — as a result of its below-average population growth rate [1]. Though the state legislature conducts redistricting in most states, California has a different process. 2010’s Proposition 20, supported by then-governor Arnold Schwarzenegger and many civil rights groups, created an independent commission to draw both Congressional and state legislative districts, which are of different sizes [2]. Proving promising following the 2010 Census, the commission was set to meet again following the 2020 Census.
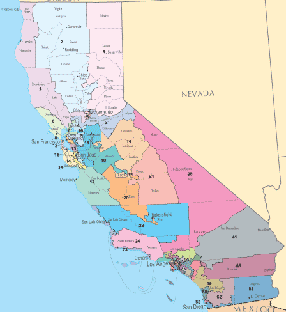
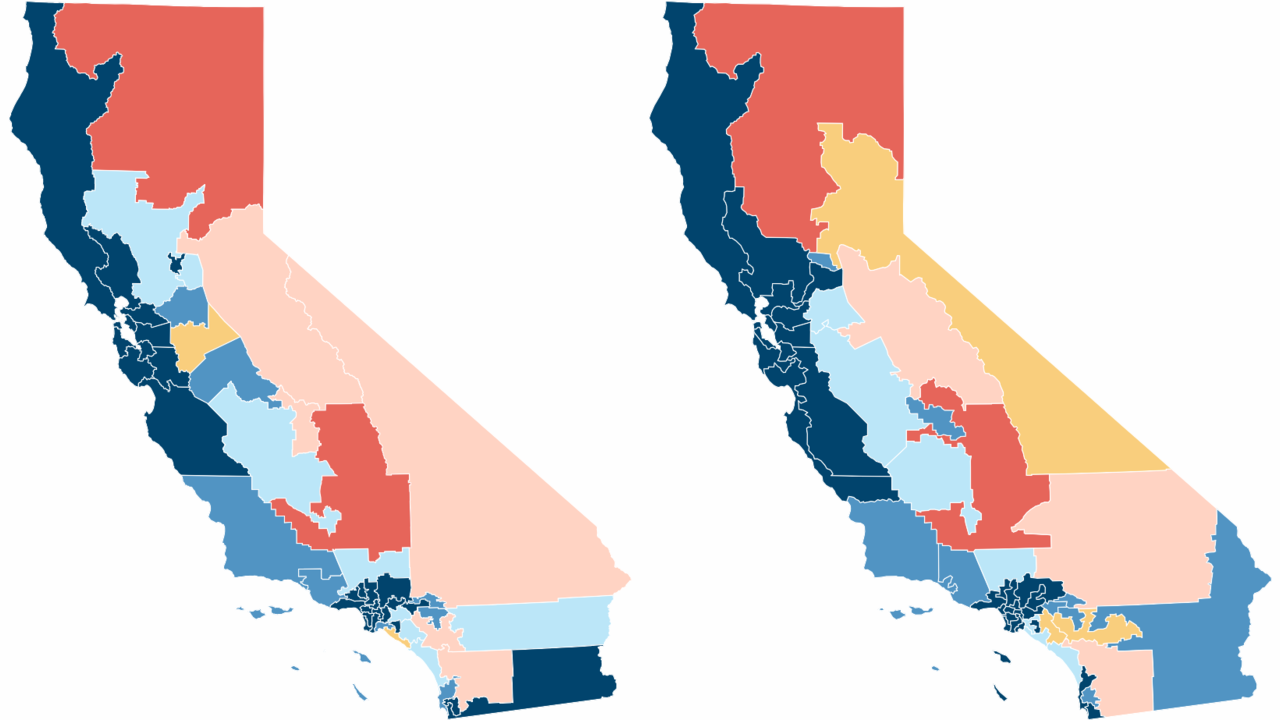
The Congressional map approved by the independent commission in 2010 (right) was significantly more compact than that approved by the legislature in 2000 (left).
California’s redistricting commission consists of five registered Democrats, five registered Republicans, and four registered independents. The California State Auditor appoints commissioners, and the governor appoints the State Auditor. In 2018, Democratic Governor Jerry Brown re-appointed State Auditor Elaine Howle [4]. Many Republicans deemed this a conflict of interest, as GOP party leadership was unable to appoint their preferred candidates to the commission; “Republican” commissioners were essentially appointed by the state’s Democratic leadership. They had reason to be dissatisfied: the profiles of the Republican commissioners did not fit that of a typical Republican. For example, Republican Commissioner Jane Anderson hails from Berkeley, where just 4% of people voted for Republican Donald Trump in the 2020 Presidential Election [5]. Anderson had also previously donated to Planned Parenthood, an organization despised by much of the Republican base.
However, the final map approved by the commission was largely fair. Intended to keep communities of interest together, the map considered public comments from citizens across the state. In one example, the 2010 map connected areas of San Diego County such as Chula Vista to Imperial County, via a strip of the sparsely-populated US-Mexico border. The 2020 map corrected this abomination after outcry from citizens. The 2020 map kept Southern San Diego County together, while uniting Imperial County with other majority-Latino areas in eastern Riverside and San Bernardino Counties. The map also increased the representation of minority groups. The number of districts where over half of the citizen voting-age population identified as Hispanic or Latino increased from 13 under the old map to 19 under the new map. For a map to be fair, minority groups ought to have a number of seats that is commensurate with their share of the statewide population. Since the number of “opportunity districts” for minority groups increased, the map became more fair – at least according to this metric.
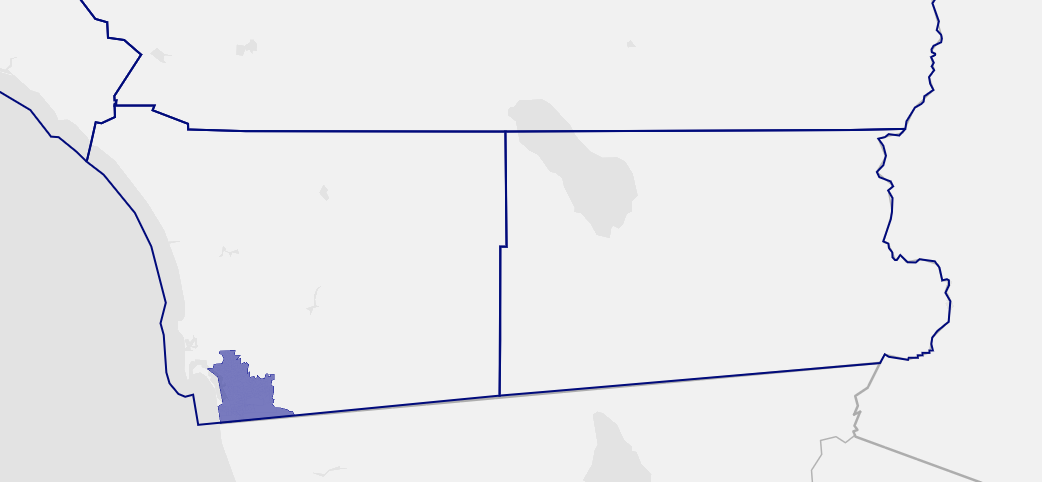
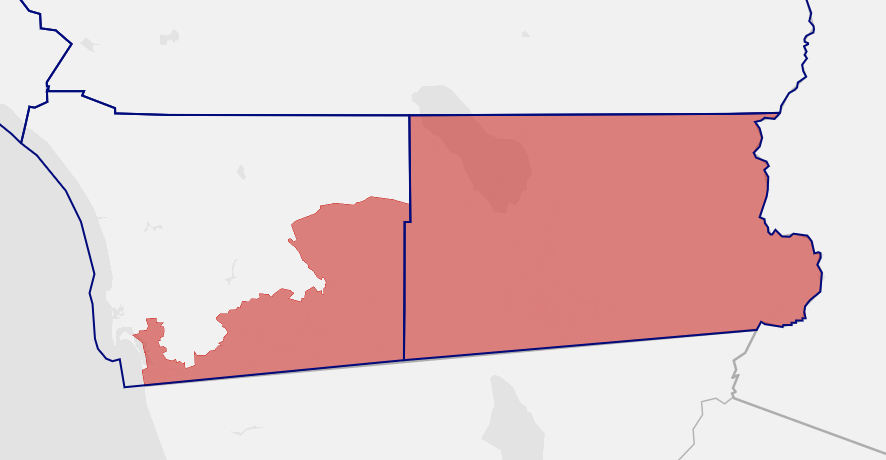
The 2020 iteration of California’s 52nd Congressional District (left) is significantly more compact than its predecessor (right).
Various statistical measures confirm that the map is fair, with a minimal Democratic bias. The efficiency gap calculation utilizes wasted votes — or votes that do not help elect a candidate — in order to compute each party’s advantage or disadvantage in a redistricting plan [8]. For example, if a Democratic candidate beats a Republican by a 52-48 margin, the Democrat will have wasted one vote (as one needs a majority of the two-party vote to win), while the Republican will have wasted 48. The efficiency gap adds up the wasted votes of each party over all districts and divides this with the total number of votes. In the 2020 California Plan, the efficiency gap is 6.77%, which corresponds to a small Democratic advantage. Nevertheless, it is important to note that California’s unique political geography naturally results in a high number of wasted Republican votes. For example, though 2020 Republican candidate Donald Trump won over a million votes in Los Angeles County (the most of any U.S. County), he did not win any of the 13 U.S. House seats that are primarily in the county [9]. Most California Republicans simply live in precincts that vote Democratic as a whole and it is difficult to draw a proportional map when this is the case.
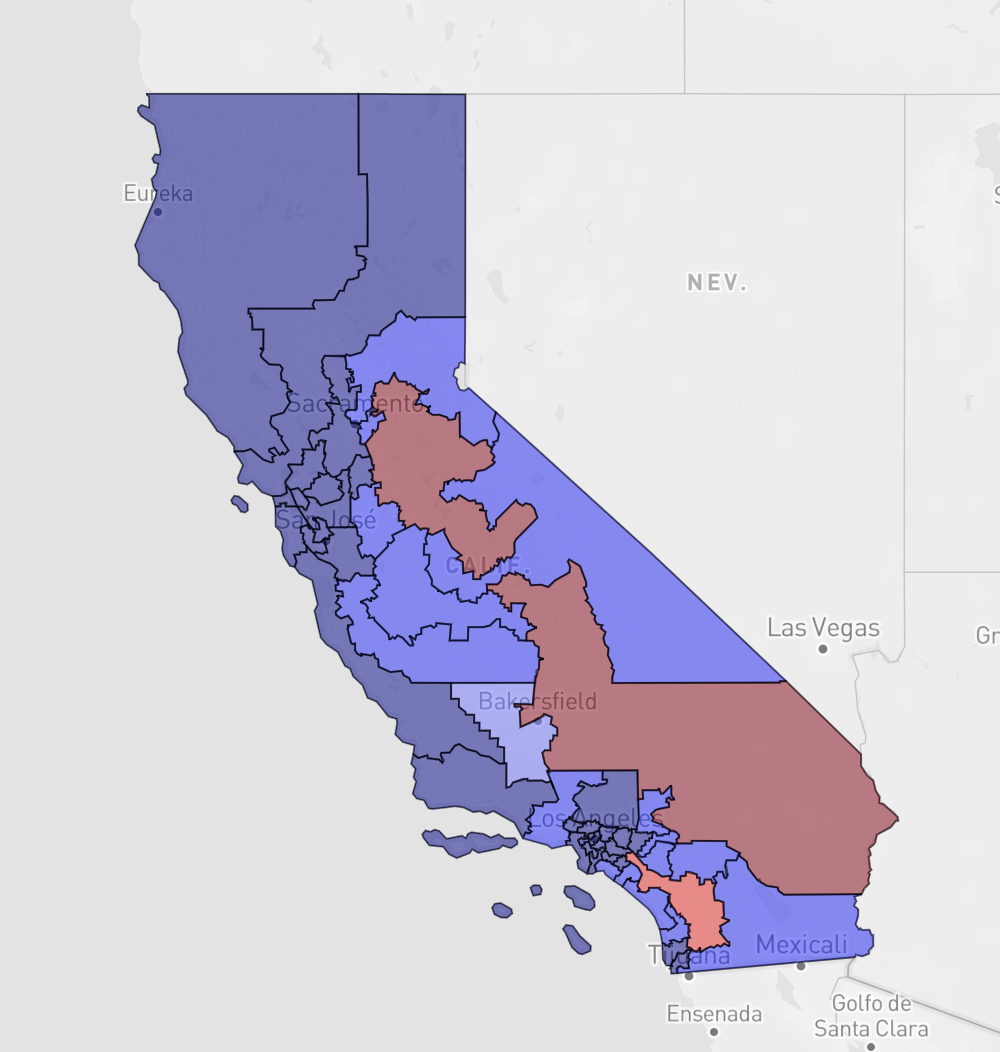
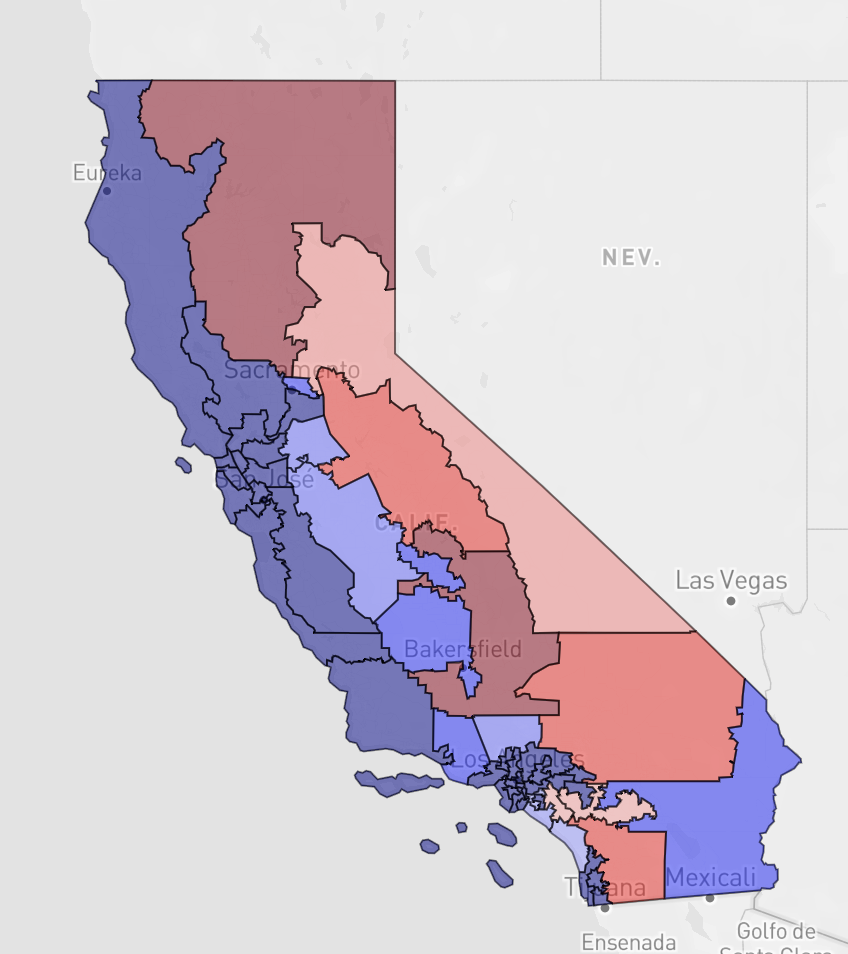
If the Democratic state legislature was tasked with drawing districts, they could draw a relatively “clean” map (left) that would consistently elect 49 Democrats and just three Republicans. The final map approved by the commission (right) is far more fair.
The seats gap, which measures the amount of seats that each party is likely to win when they receive 50% of the statewide vote, is minimal. If each party received 50% of the votes in the 2022 Congressional Elections in California, Democrats would be expected to win 28 seats, while Republicans would win 24. This is a statistically normal result that reflects a non-gerrymandered map.
The map also includes numerous highly competitive districts. Eight seats were decided by less than 11 points in the 2020 Presidential Election [10]. Many of these seats are up for grabs, especially when considering that the 2022 midterm elections are expected to favor Republicans; midterm elections typically favor the opposition party [11]. Additionally, California voters have demonstrated a willingness to split their tickets in recent years, a trend that favors Republicans. In the 2020 Election, Republican David Valadao prevailed in the 21st District even as Democratic candidate Joe Biden won the district by over 11 points, while Republicans Mike Garcia and Young Kim prevailed in the 25th and 39th districts, respectively, as Biden won each of their districts by over ten points [12]. Even though calculations such as the efficiency gap and seats gap are typically conducted using results from presidential elections, California voters tend to split their tickets in legislative elections, making districts far more competitive than they appear at first glance.
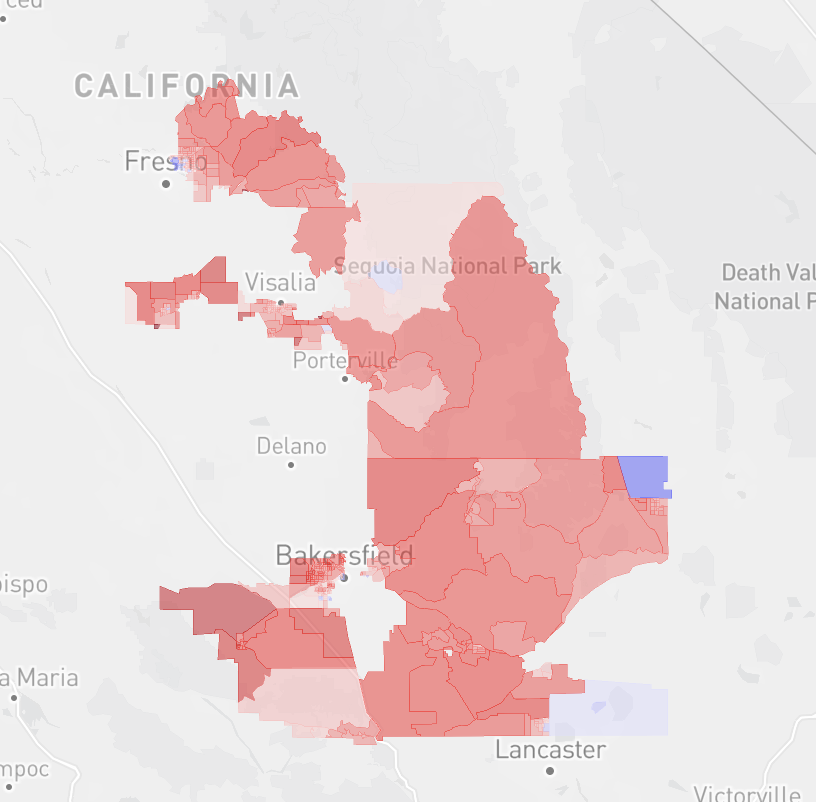
At first glance, the 20th District appears extremely gerrymandered.
It is understandable that Republicans would take issue with a few districts on the map. The 20th District in the Central Valley appears gerrymandered, packing Republican voters in Kern, Kings, Tulare, and Fresno counties. Upon closer inspection, one can see that these Republican areas are also extremely white. The creation of this district allowed a new majority-Latino district, the 21st, to be created. Tradeoffs are inherent in redistricting – increasing minority representation can often result in “packing” Republican voters, who tend to identify as white, into a smaller number of districts.
Republicans had many reasons to be skeptical of the 2020 iteration of California’s Citizen Redistricting Commission, but the final map provides ample opportunities for each party to win the number of seats that corresponds with its portion of the statewide vote. Though elections in California may rarely be competitive at the statewide level, those to the United States House of Representatives will assuredly be interesting and competitive throughout the decade.
Sources
1. "2020 Census Apportionment Results." United States Census Bureau, 26 Apr. 2021, www.census.gov/data/tables/2020/dec/2020-apportionment-data.html. Accessed 3 Mar. 2022.
2. "California Proposition 20, Congressional Redistricting Initiative (2010)." Ballotpedia, ballotpedia.org/California_Proposition_20,_Congressional_Redistricting_Initiative_(2010). Accessed 5 Mar. 2022.
3. "Maps: Final Certified Congressional Districts." We Draw the Lines California, wedrawthelines.ca.gov/maps-final-draft-congressional-districts/. Accessed 5 Mar. 2022.
4. "Governor Brown Announces Appointments." Office of Governor Edmund G. Brown, Jr., 26 Jan. 2018, www.ca.gov/archive/gov39/2018/01/26/governor-brown-announces-appointments-5/index.html. Accessed 4 Mar. 2022.
5. Wrenn, Rob. "The Berkeley Daily Planet." How Berkeley Voted: Biden 93.3%; Trump 4.0%, 13 Dec. 2020, www.berkeleydailyplanet.com/issue/2020-12-11/article/48899. Accessed 9 Feb. 2022.
6. "California 2022 Congressional." Dave's Redistricting App, davesredistricting.org/maps#viewmap::fc9d2d06-7c7f-451c-92cb-122127a79c29. Accessed 2 Mar. 2022.
7. Ibid.
8. Stephanopoulos, Nicholas, and Eric McGhee. "Partisan Gerrymandering and the Efficiency Gap." SSRN, 23 June 2014, papers.ssrn.com/sol3/papers.cfm?abstract_id=2457468. Accessed 9 Mar. 2022.
9. "2020 General Election." LA County Election Results, 30 Nov. 2020, results.lavote.gov/#year=2020&election=4193. Accessed 9 Mar. 2022.
10. "California 2022 Congressional." Dave's Redistricting App, davesredistricting.org/maps#viewmap::fc9d2d06-7c7f-451c-92cb-122127a79c29. Accessed 2 Mar. 2022.
11. Prokop, Andrew. "The Presidential Penalty." Vox, 1 Mar. 2021, www.vox.com/22899204/midterm-elections-president-biden-thermostatic-opinion. Accessed 9 Mar. 2022.
12. "California House Election Results 2020." NBC News, 17 Feb. 2021, www.nbcnews.com/politics/2020-elections/california-house-results. Accessed 9 Mar. 2022.